|
|
|
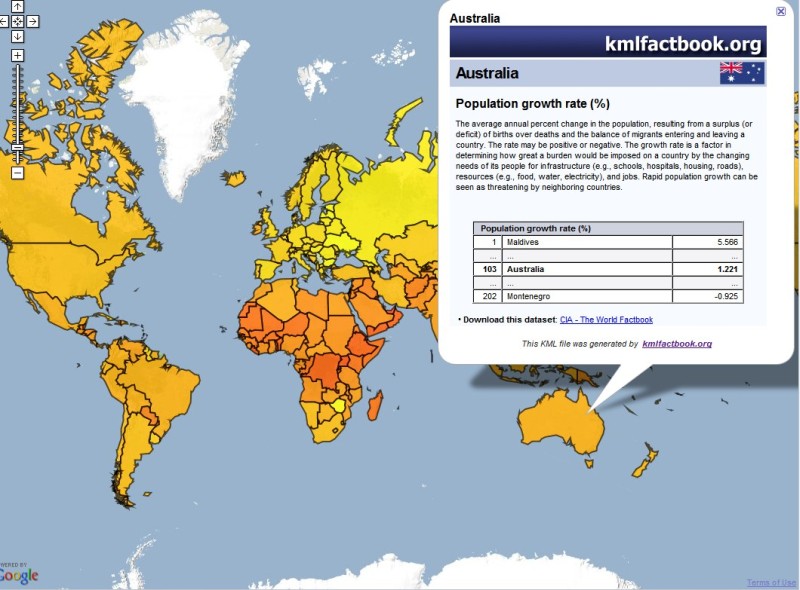

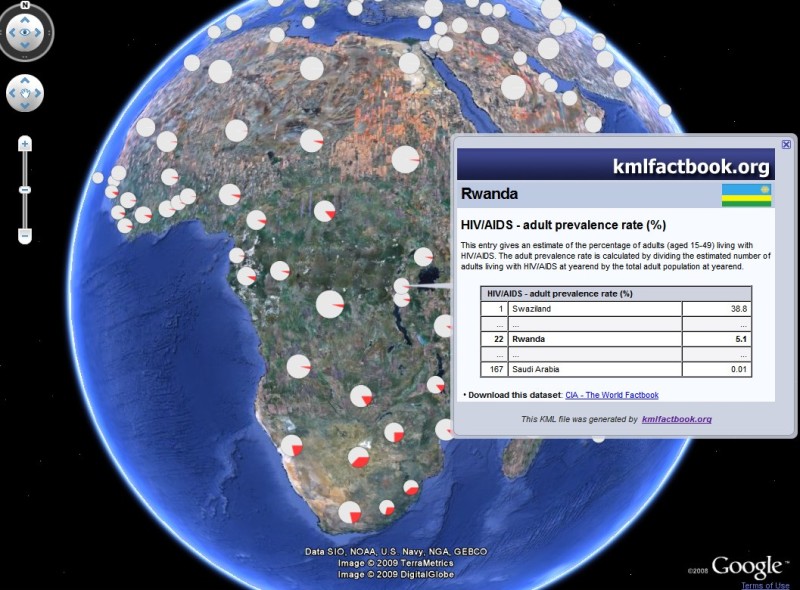
kmlfactbook.org helps you create Google Earth KML files like the examples above from your own custom data.
Basic Usage
 |
 |
|
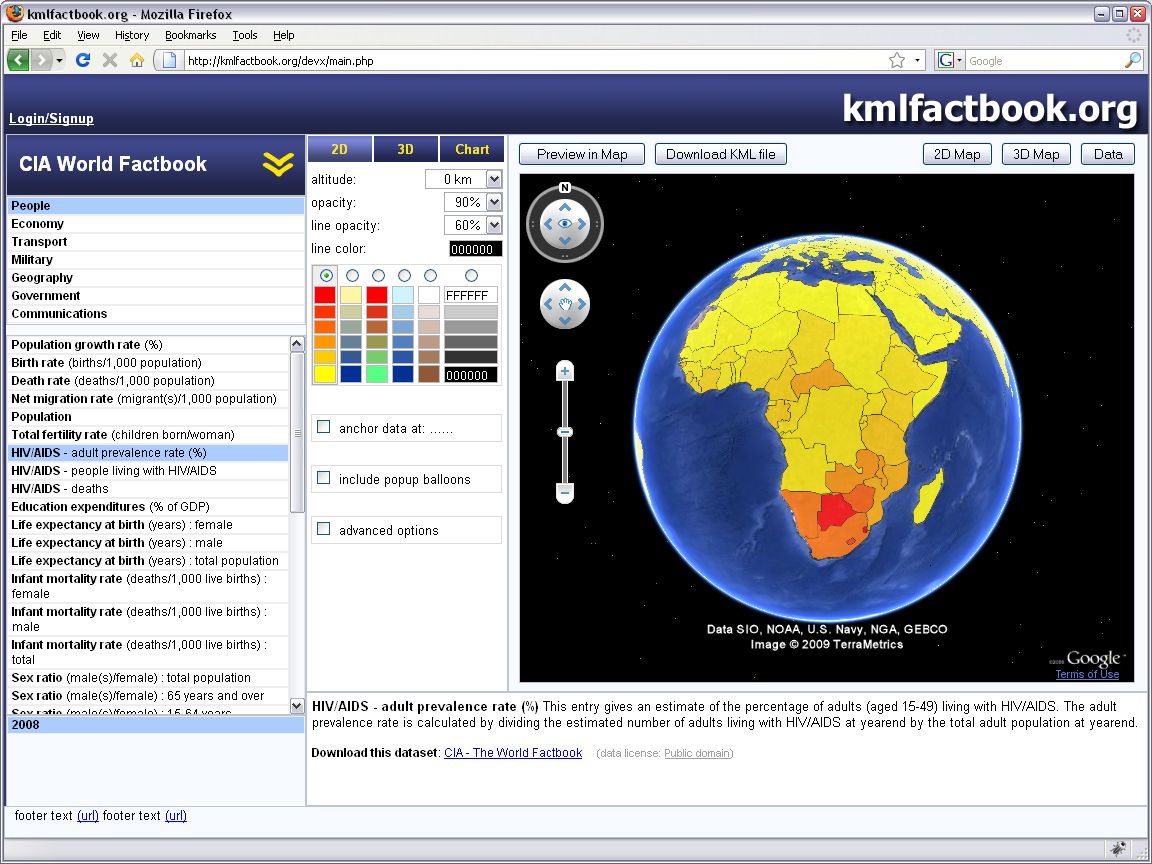
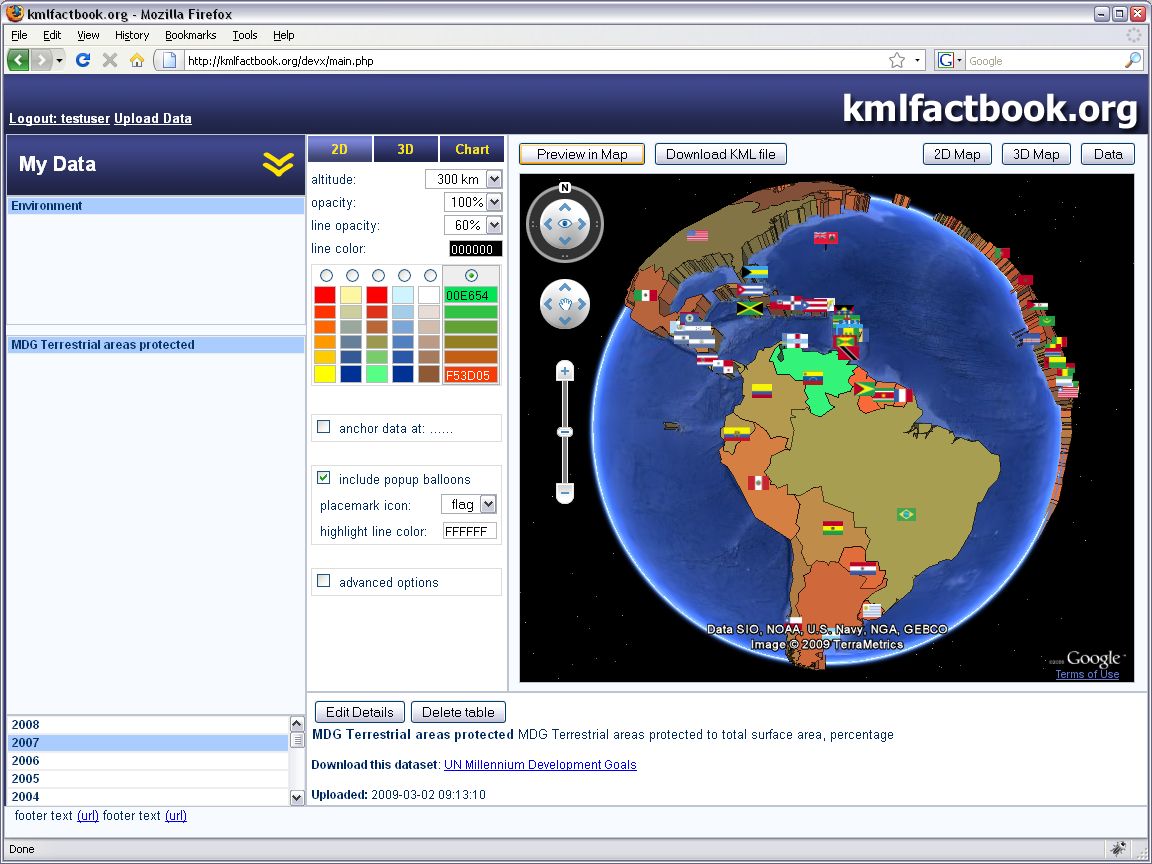
 kmlfactbook.org can use either Google Maps or the Google Earth browser plugin to preview the KML files that you create.
To switch between the two modes press the 2D Map and 3D Map buttons to the right in the screen.
kmlfactbook.org can use either Google Maps or the Google Earth browser plugin to preview the KML files that you create.
To switch between the two modes press the 2D Map and 3D Map buttons to the right in the screen.The Preview in Map button will show the selected data-set in the Google Maps or Earth plugin preview window.
The Download KML file button will download the same file to be saved locally on your disk or opened in the standalone Google Earth application.
 |
|
|
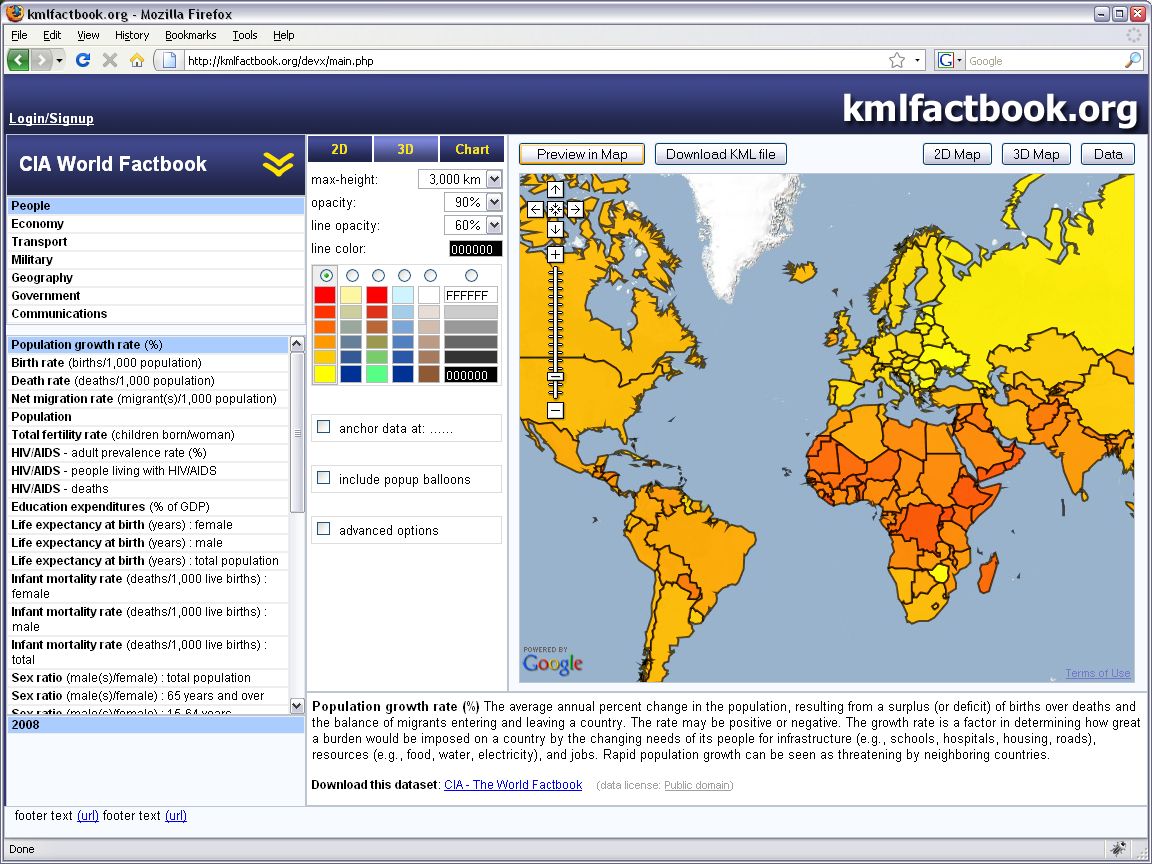
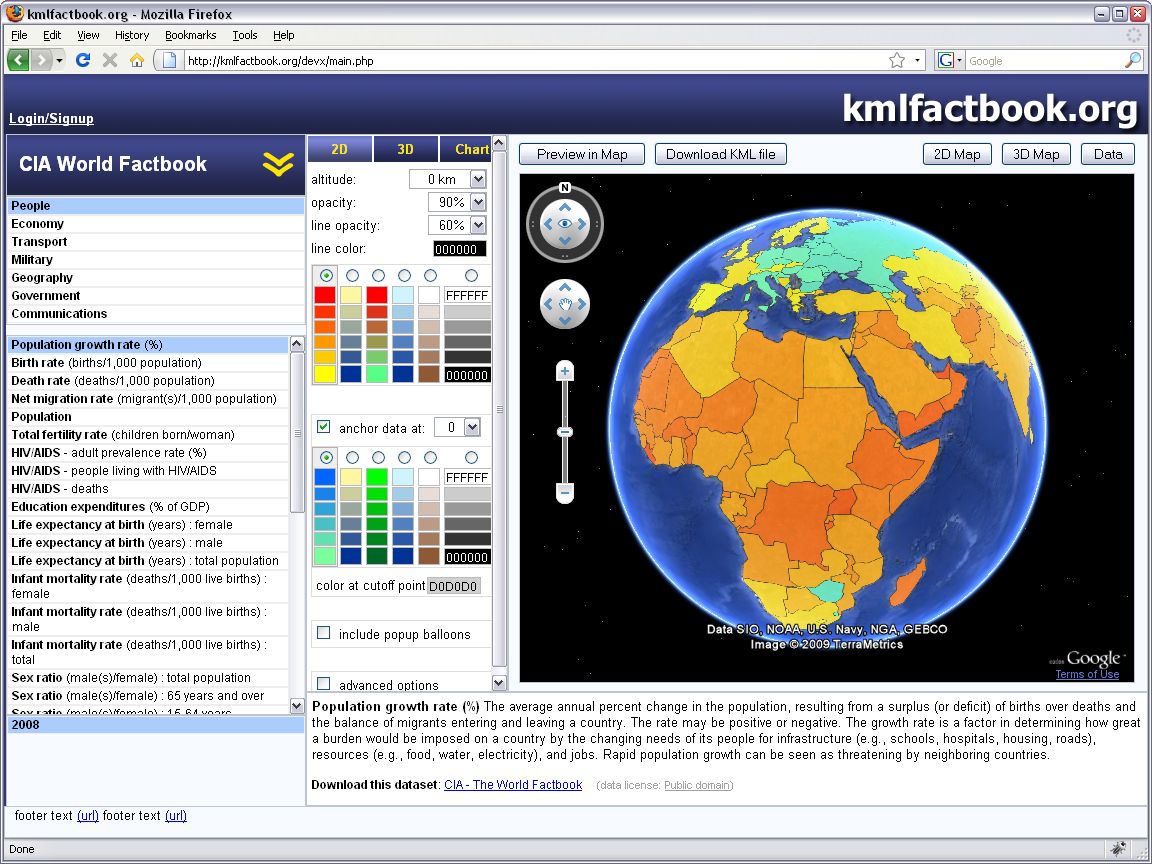
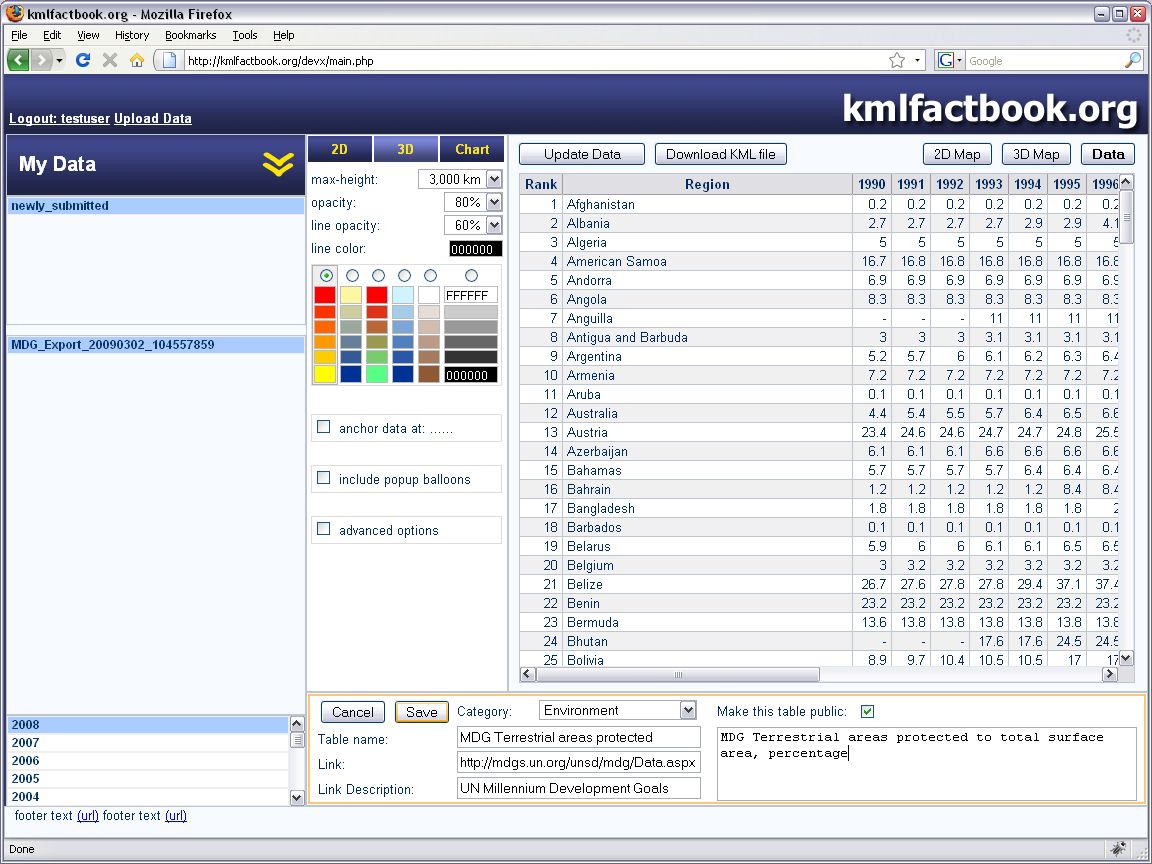
Select which data-base to use from the top-left drop-down menu (currently available data is the CIA World Factbook, World Resources Institute EarthTrends, UN Data as well as user submitted data).
Below the data-base drop-down select the data category (People, Economy, Geography, etc.), then select the particular data-table that you want to work with.
Once the table is selected the third list at the bottom of the page will update to show the columns available in this data-table (usually a list of years the data is available for). The information area below the Map preview will also update with information about this data-set, as well as a link to the source.
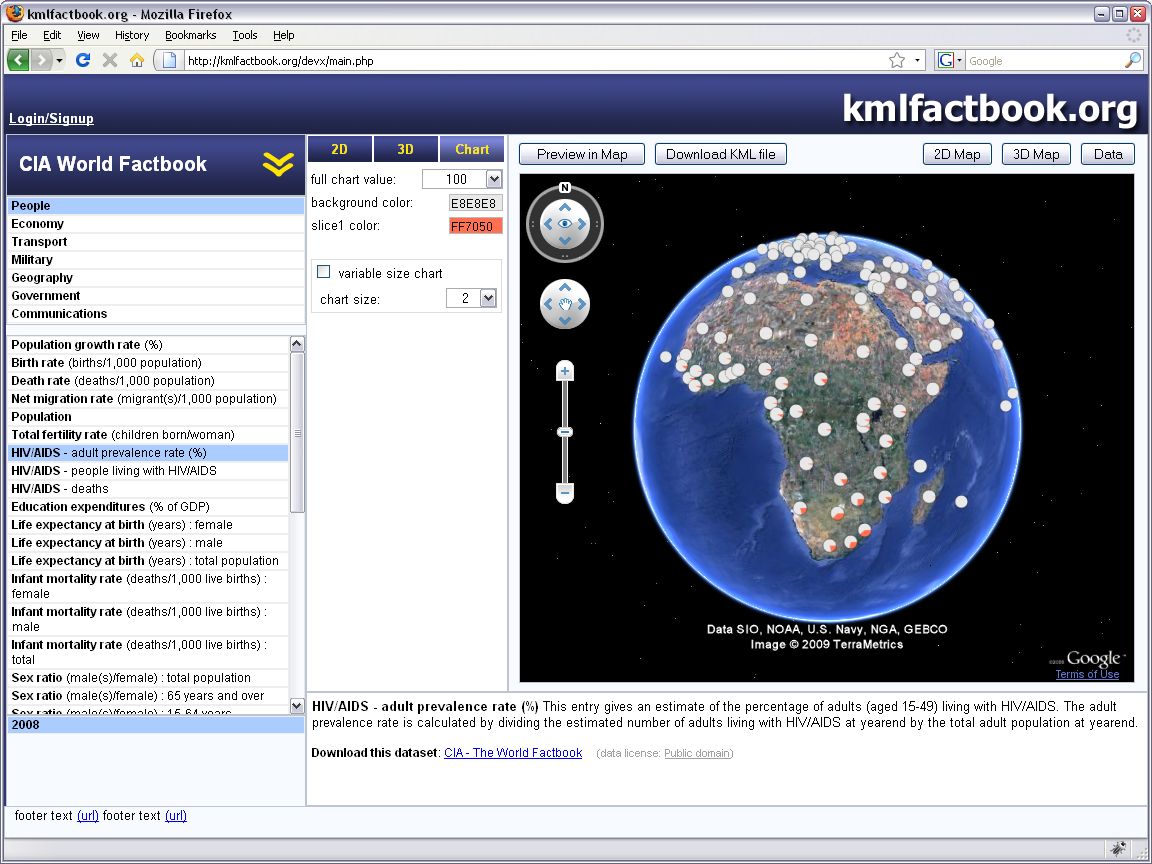
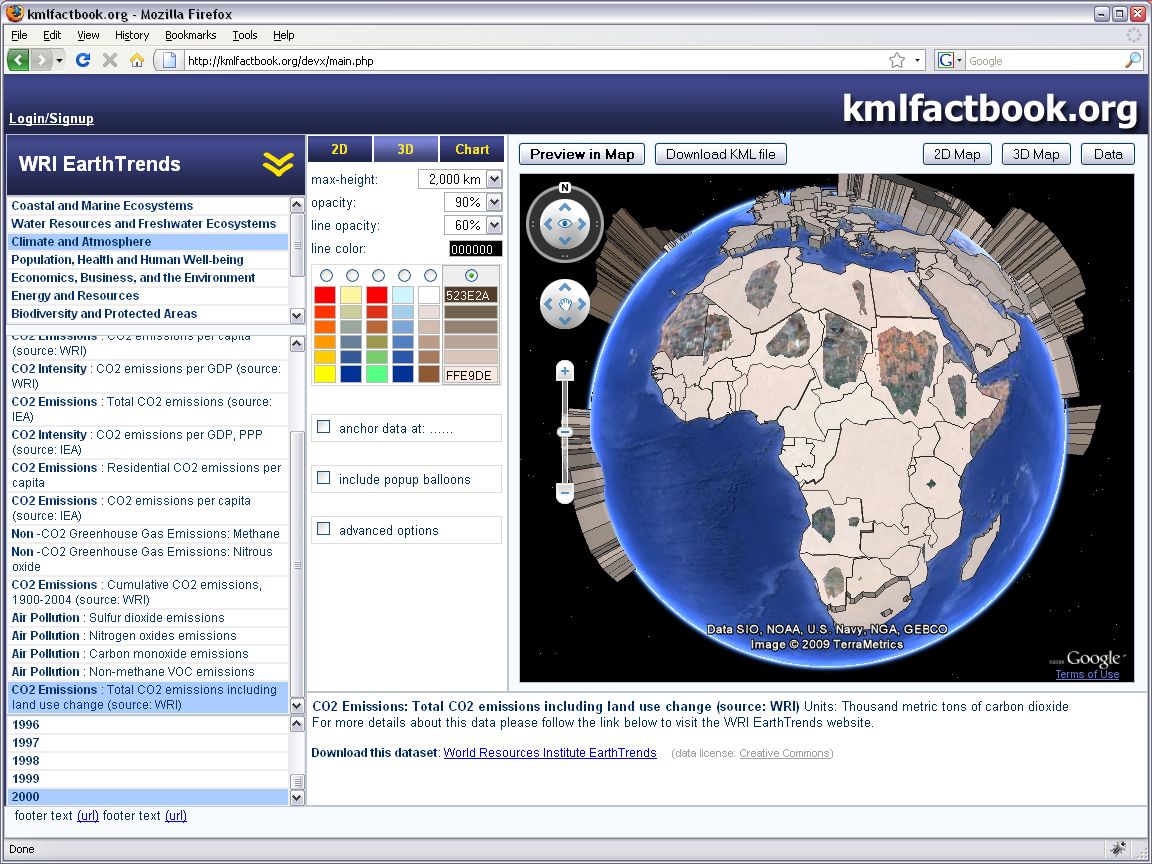
To select which type of visualization to create from the data pick one of the 2D, 3D or Chart tabs. The following screenshots show the same data visualized in each of the three different modes.
|
|
|


KML Options
Each of the 2D, 3D or Chart tabs has it's own set of options where you can edit the output KML file. For most settings you can leave the mouse cursor resting over the option for one or two seconds to read a short context-sensitive help message.For the 2D and 3D tabs you can select the colors and transparency (opacity) of the region polygons, as well as of the line tracing the borders.
On the 3D tab you can also select the maximum height of the region polygons (the height that will be applied to the highest value in the data). For 2D an optional altitude can be selected that will be applied equally to all regions.
 |
|
|
 |
|
|
The color at cutoff point color is used for data that is exactly on the threshold level.
 |
|
|
For the Chart visualization type you can select which number would make up a full circle (default is 100), or choose to show the data for other regions as percentage of the highest value with the full chart value: data max setting.
You can also choose the color for each data slice, and weather to use a fixed or variable size chart. With the variable size setting the size of the chart on the map can be relative to each country's area or to its population.
Advanced Options
 |
|
|

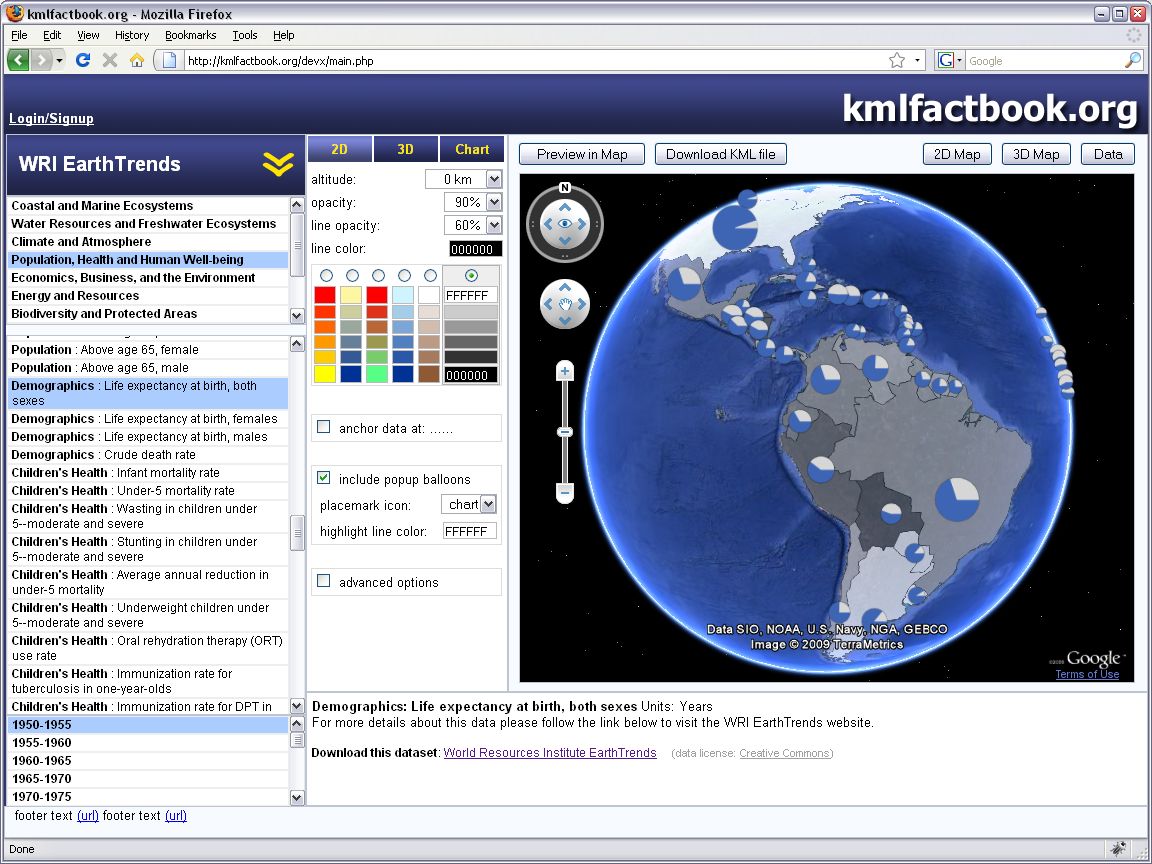
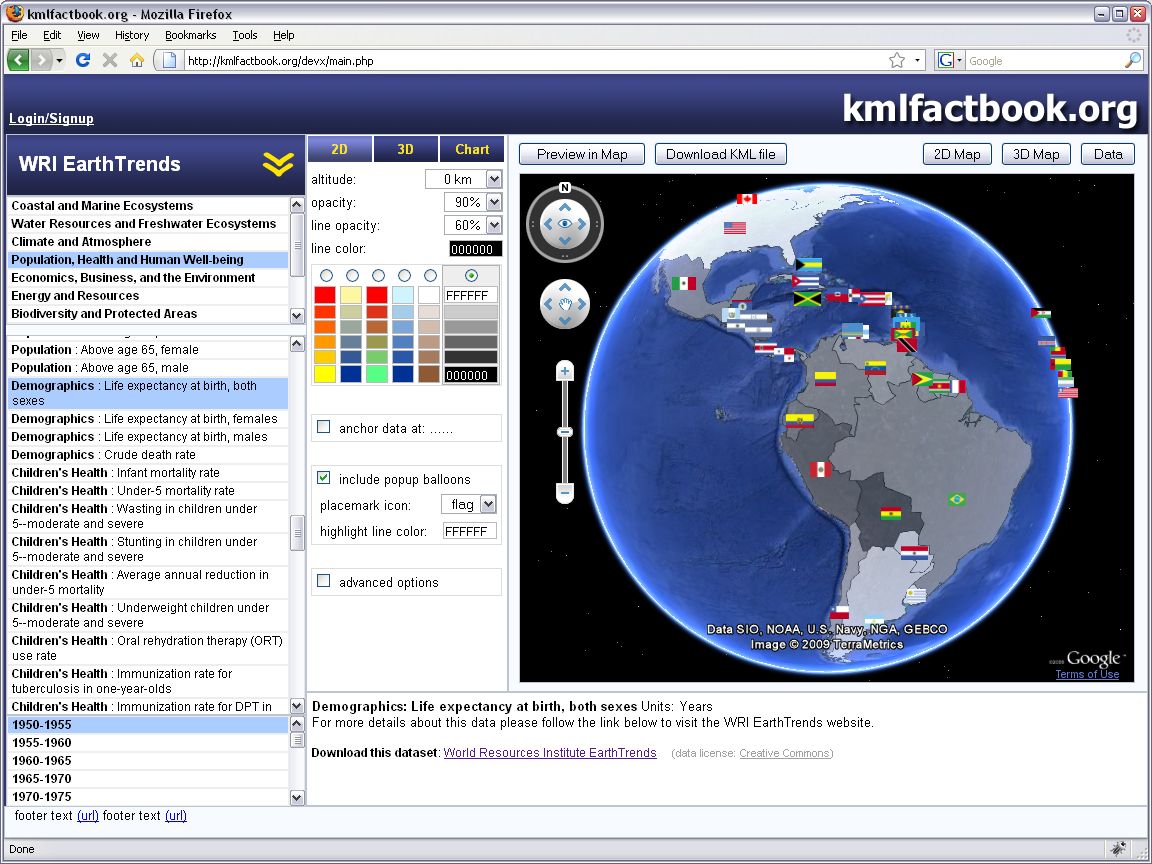
You can also optionally choose a placemark icon for each country, select flag to use each country's national flag. By selecting chart the current settings from the Chart tab will be used, combining the two types of visualizations in one.
The include time-tag advanced option includes a <TimeSpan> tag in the KML code, which can be useful if you want to save a number of KML's from kmlfactbook.org to combine into a time-slider animation in the Google Earth application. (The option only works if the column name is a 4 digit year, and does not change what is seen in the kmlfactbook.org preview window.)
The Google Maps compatible advanced option sets weather to use <ExtendedData> tags in the KML code. By unchecking this option the HTML code that makes up the popup balloon is only included once in the KML output, making it easier to edit the style of the popup balloons. (Without this option popup balloons do not work in Google Maps or in the kmlfactbook.org preview window in 2D Map mode.)
 |
|
|
The flatten below advanced option can help avoid "curvature clipping" - when the ground pops up through the middle of a polygon. This is most likely to happen with a country with a large area and a polygon with a low height. Use this option to flatten all polygons below the configured height to avoid the issue. (only relevant when using the 3D tab)
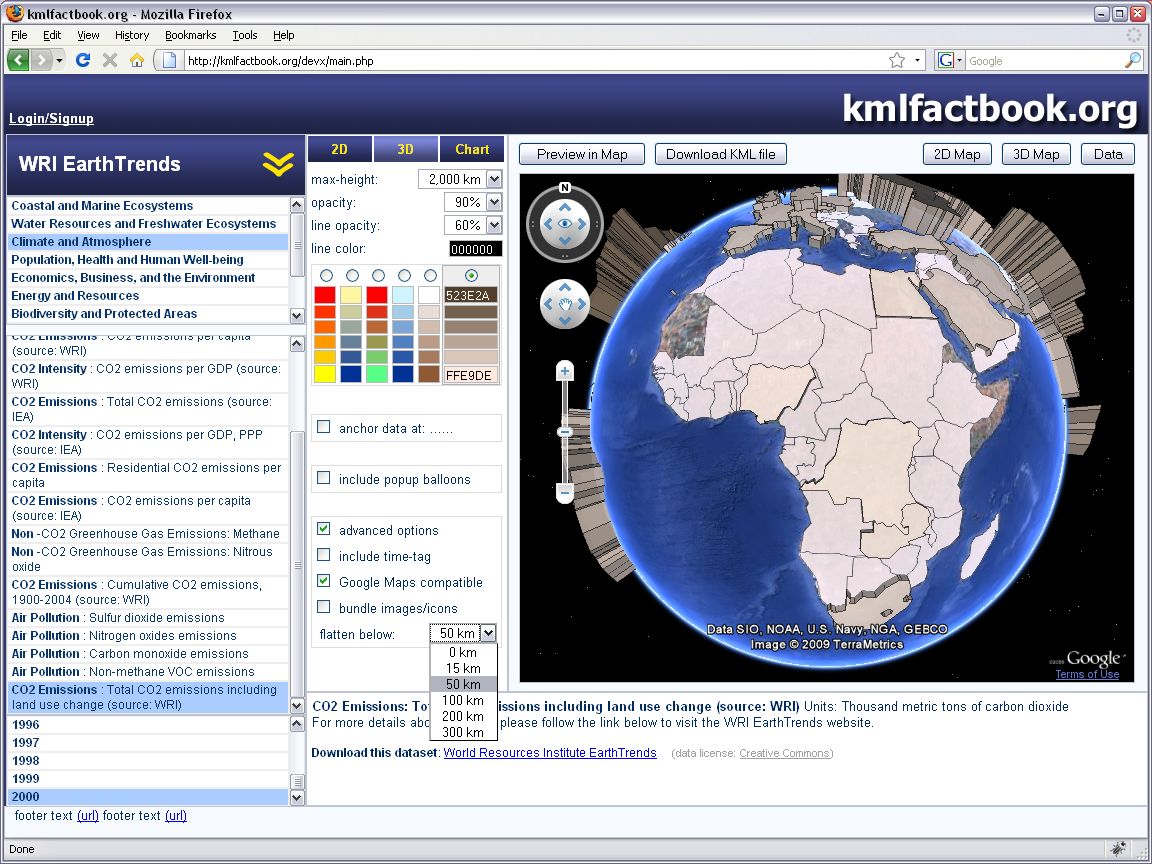
The bundle images/icons advanced option will include the popup balloon logo and flag icons inside the KMZ output file, making sure it will work in the Google Earth application also in offline mode.
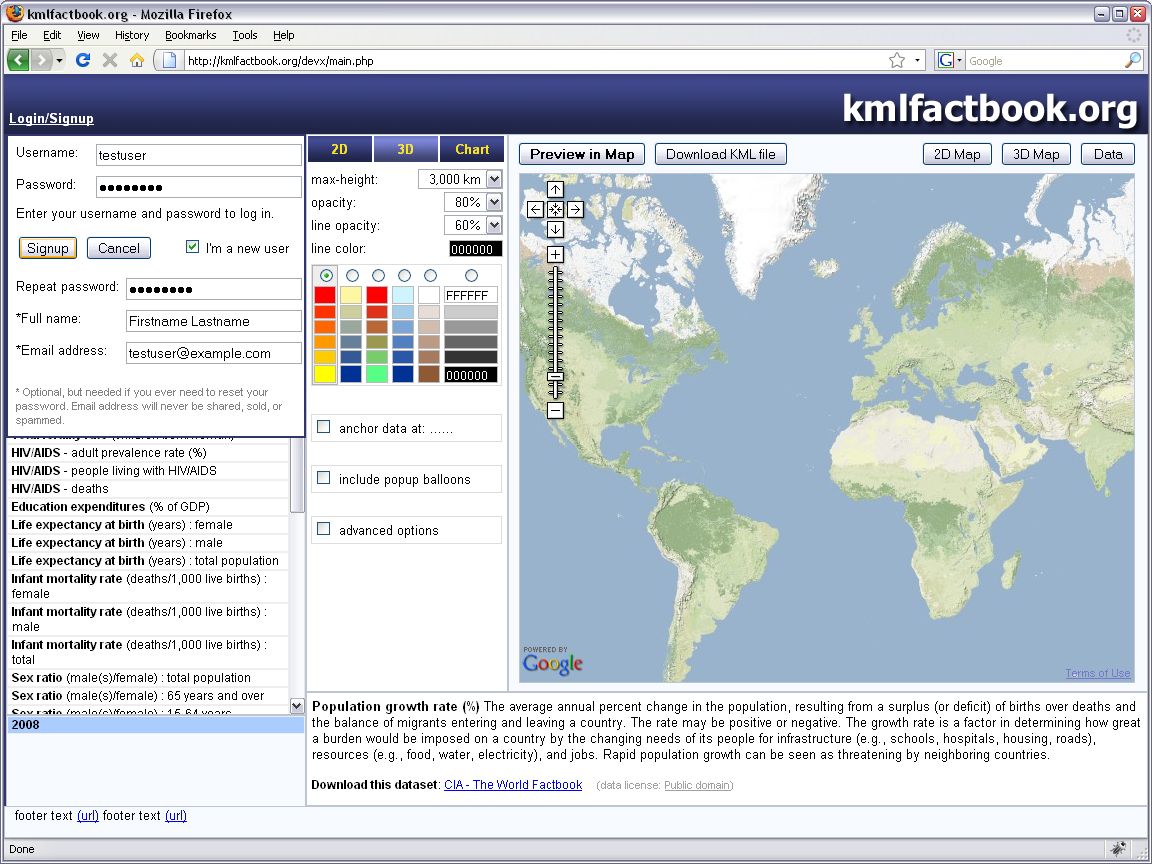
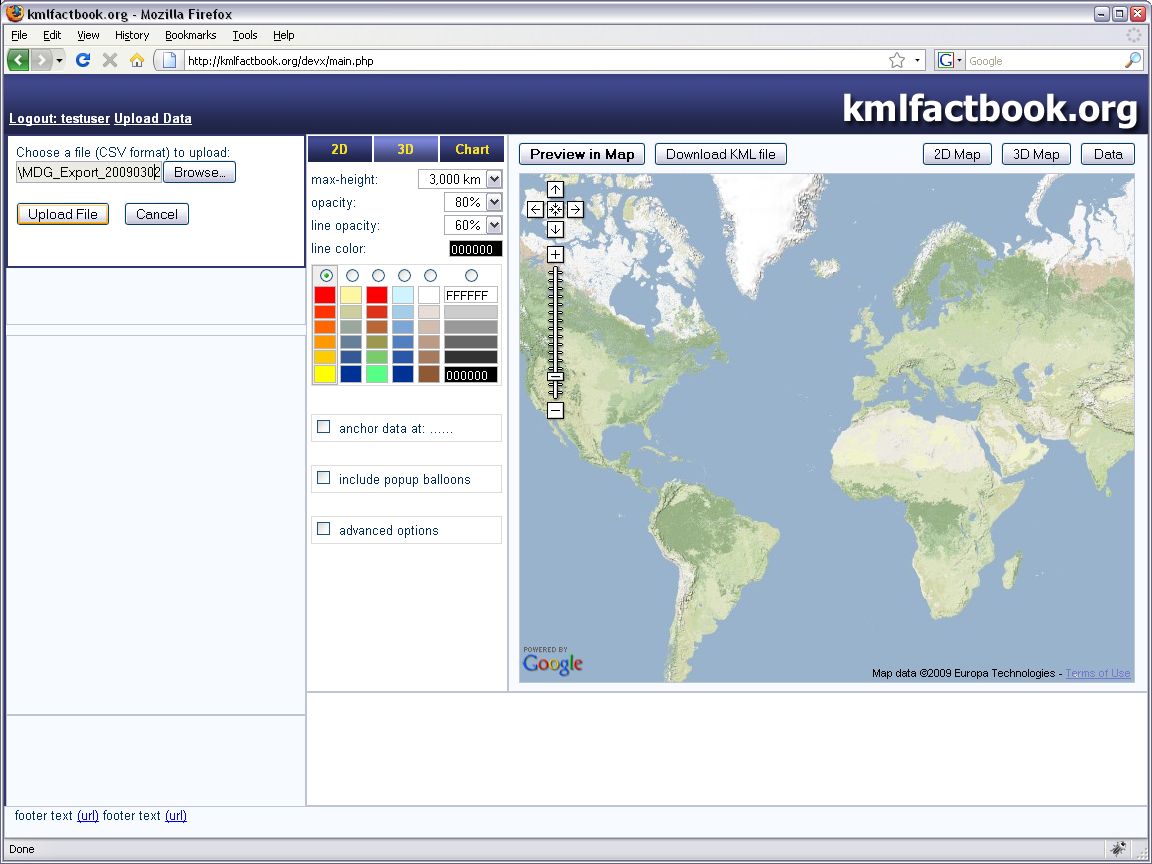
Uploading Data
 |
|
|
 |
|
|
 |
|
|

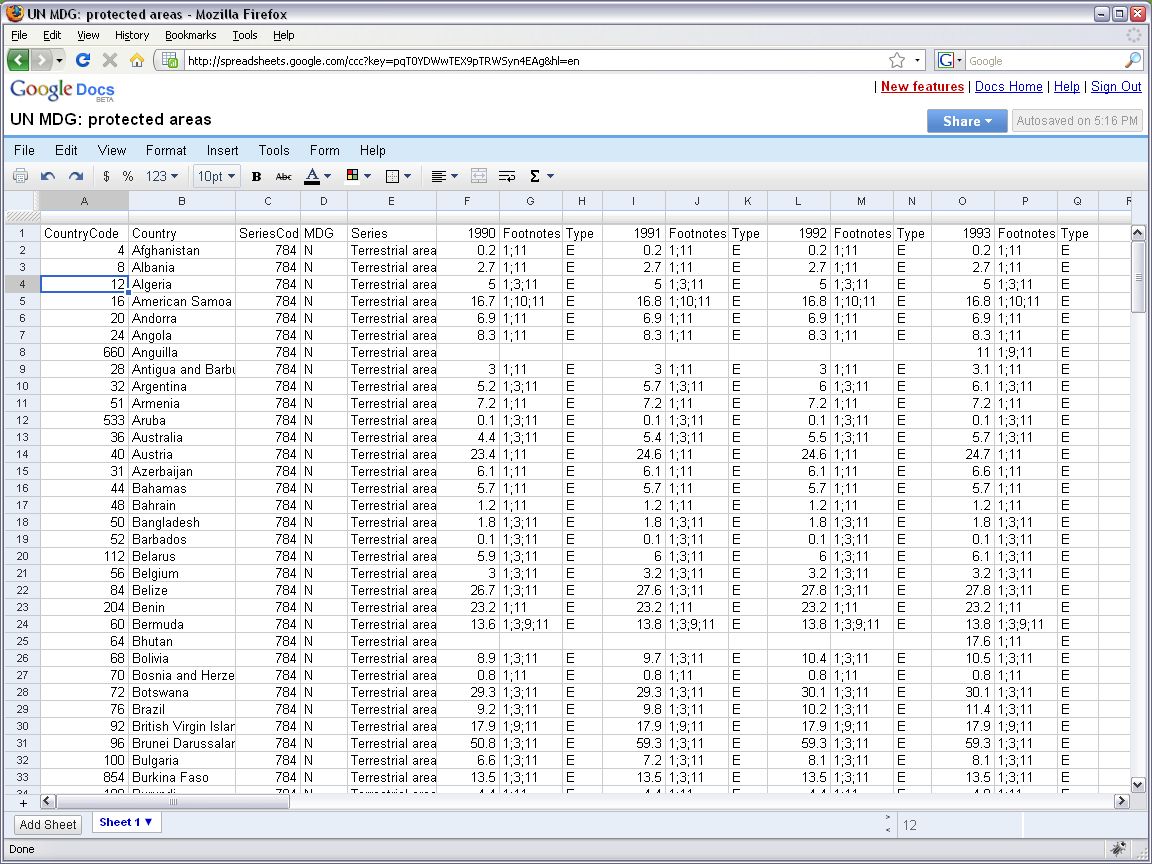
One column in the uploaded data table needs to contain country names (preferably the first column, but the site should be able to figure it out automatically in most cases). Other columns will be parsed for numeric data - only the first numeric value in each cell will be kept, all other data will be discarded. Rows with the wrong number of columns will also be discarded.
In most cases the site should be able to find the column names if they are present in the file on any of the rows above the first data row. Additionally, if the very first row (above the column header rows) contains only a single cell it will be used as the name for the data-set.
To view the uploaded data press the Data button next to the 2D Map and 3D Map buttons to the right. Country names that could not be recognized by kmlfactbook.org will be highlighted in orange. (at the moment kmlfactbook.org only works with country level data - support for state level data may be added later.)
 |
|
|
 |
|
|
Once your file is uploaded you can edit the category, name and description for the data, as well as enter a link if the data is available online. If the option to Make this table public is checked the table will be listed when the User Submitted database is selected, no matter who is logged in (custom uploaded data is by default visible only to the user who uploaded it). If the data that you have uploaded might be useful to other visitors also please do mark it as public.
How do I...?
Change the look of the placemark popup balloons?
There is no functionality yet on kmlfactbook.org to change the look of the placemark popup balloons, but if you are happy to edit the HTML code inside the KML file yourself you can uncheck the advanced option for Google Maps compatibility before saving the file. Unchecking this option allows the HTML template to be included only once inside the KML instead of once for each placemark, which makes it easier to edit afterwards (kmlfactbook will also format the HTML code to better suit editing). The KMZ file you download is simply a ZIP file with a KML file inside it, which can be extracted with any standard zip archiving tool like Winzip etc.Another option is to disable popup balloons for the file you create on kmlfactbook.org, and use Google's Spreadsheet Mapper tool to create a second KML file with the popup balloon design that you want. You can then combine the two KML files into one using the Google Earth application before publishing.
Embed the Google Earth plugin with a kmlfactbook.org visualization on my own site?
If you have already downloaded a KML file from kmlfactbook.org and published it somewhere on the internet, you can use Google's Earth Plugin gadget to include the Earth browser plugin on your own page.(an Embed KML option may be included directly on kmlfactbook.org in the future.)
About kmlfactbook.org
The aim of kmlfactbook.org is to help you create impressive Google Earth presentations from your global data-sets.If you find any bugs on kmlfactbook.org or have any suggestions for improvement please email admin@kmlfactbook.org.
The kmlfactbook.org site is run as a one-man project by David Tryse.
Follow this link to view some of my other Google Earth projects: http://earth.tryse.net/
If you require something more flexible than kmlfactbook.org, or need to incorporate similar functionality into your own project I would recommend the Thematic Mapping Engine by Björn Sandvik. It is not the engine that runs kmlfactbook.org (though it does use the same border dataset), but it is most likely more flexible for incorporating into a larger project.
Thanks
Code:
Most of the code that runs this site is written from scratch, but I'd like to thank the creators of the following libraries:• jscolor Javascript Color Picker by Honza Odvarko (used in the KML setting tabs)
• Javascript MD5 by Paul Johnston (used in login code)
• Javascript Table Sort by Mike Hall (used in Data preview)
• json-sans-eval Javascript JSON Parser by Mike Samuel (used for data transport on non-native-JSON browsers)
• ...and of course Google for Google Earth, and the Earth and Maps API's!
Data:
• World Resources Institute EarthTrends (fantastic set of environmental data available under a creative commons license)• CIA World Factbook (large database of global data published as public domain)
• World Borders Dataset (by Björn Sandvik, thematicmapping.org)